
Chrome DevTools MCP: let your agent debug in real Chrome
DebugBear's founder handed this to Gemini and cut a test page's LCP from 1383ms to 628ms
- Who
- Made by Google's Chrome DevTools team, for people whose coding agents work on web pages.
- When
- The repository opened in September 2025; the latest release is 1.13.0 of November 11, 2026 (logpoints, page-scoped network mocks).
- Where
- Runs with MCP clients such as Antigravity, Claude, Cursor and Copilot, and starts Chrome on your own machine.
What was hard
Ask an agent to fix a page and it changes the code, but it cannot see what happened in the browser. So after every change you open the page, copy console errors back into the chat, and when it feels slow you record a trace in DevTools and explain it again.
What it does about it
Chrome DevTools MCP lets the agent do that checking itself. It opens a real Chrome, clicks through the page, reads network requests and console messages, takes screenshots and records performance traces. The key idea is that the agent gets, as text, the analysis from the same engine a person reads in DevTools. The package also carries the chrome-devtools CLI for use without MCP and seven skills that teach the order of jobs such as LCP or accessibility work.
npm i chrome-devtools-mcp@latest -gchrome-devtools navigate_page 1 --url "https://developers.chrome.com"chrome-devtools take_screenshot 1 --filePath screenshot.pngchrome-devtools stop
What people made with it
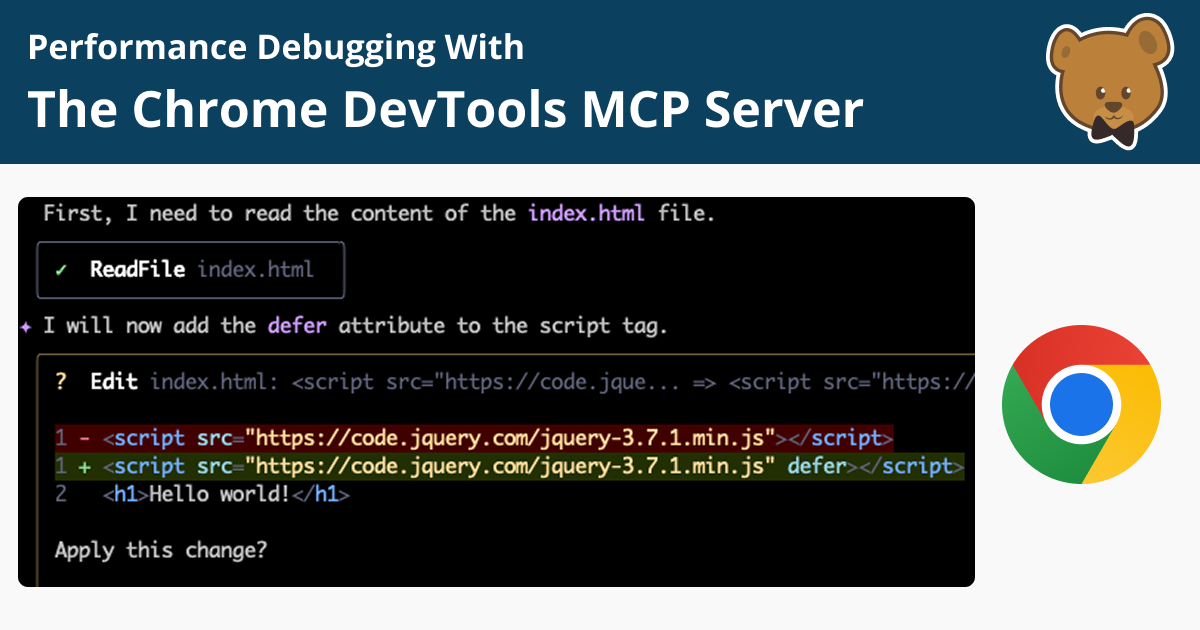
He had Gemini measure a test page throttled to Slow 4G, accepted its suggestion to defer a render-blocking jQuery script, and more than halved the LCP.
The new Largest Contentful Paint (LCP) is now 628ms, down from 1383ms.
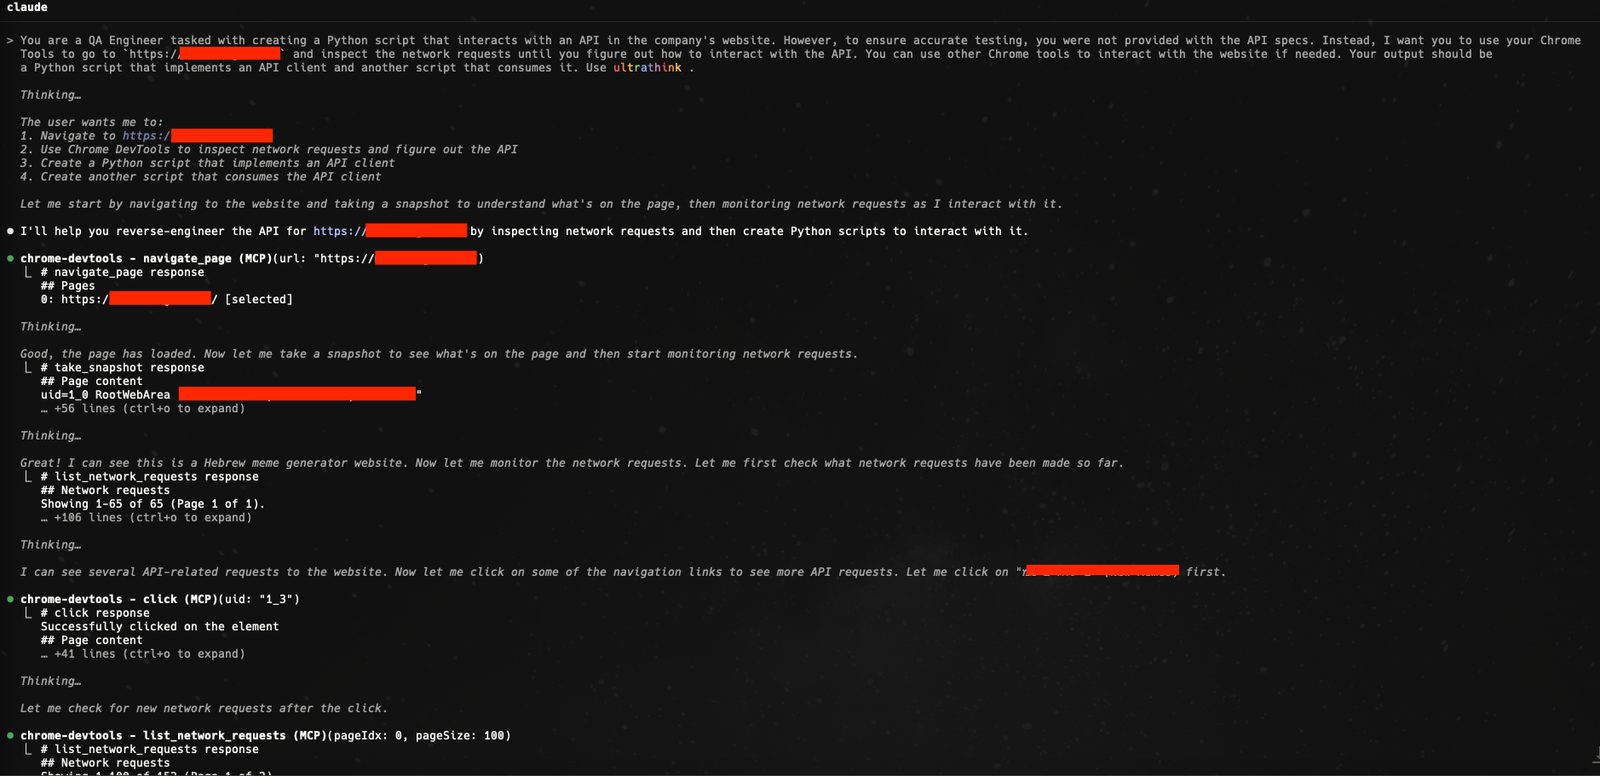
He had Claude Code read a site's network requests and write a Python API client. The dump was too large, so he added pagination and filtering to this MCP, and that change was merged.
A fully reverse-engineered client for an undocumented API, generated in one shot.
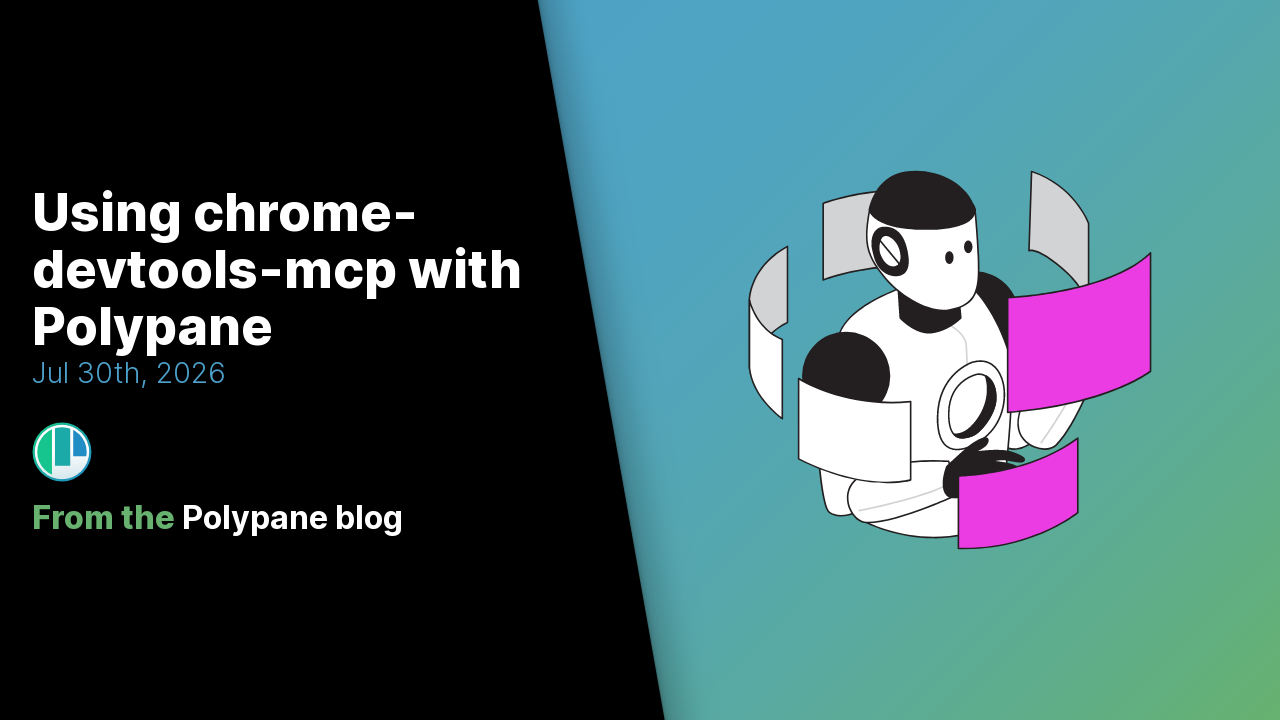
They connected it to Polypane, a browser with several viewports side by side; the agent took screenshots of both panes, changed the CSS and checked it with new screenshots.
It made screenshots in Polypane in both panes, made a change and then verified the change by making new screenshots:
How it runs inside
- 1
You → Claude Code
Check the performance of https://developers.chrome.comYou send the agent the one line the README gives as a first prompt. - 2
Claude Code → chrome-devtools-mcp
performance_start_trace callThe agent calls the MCP tool; the server takes reload and autoStop and prepares the recording.src/tools/performance.ts - 3
chrome-devtools-mcp → Chrome
puppeteer.launchThe server starts Chrome the first time a tool needs a browser.src/BrowserManager.ts - 4
chrome-devtools-mcp → Chrome
tracing.start, reload the pageIt clears to about:blank, starts tracing, loads the page again and stops after 5 seconds.src/tools/performance.ts - 5
Chrome → DevTools TraceEngine
trace bufferThe DevTools TraceEngine parses the recorded trace and computes insight sets.src/processors/PerformanceTrace.ts - 6
DevTools TraceEngine → Claude Code
trace summary and insight listThe server attaches the summary and the ids of the available insight sets to the tool's answer.src/McpResponse.ts - 7
Claude Code → LCP cause and what to fix
performance_analyze_insight: LCPBreakdownFollowing the skill's order, it opens insights one by one and says which of LCP's four parts is slow.skills/debug-optimize-lcp/SKILL.md
What goes in, what comes out
Is it for you
Good for
- You want the agent to check its own UI changes in a browser
- You want to know which part of LCP makes a page slow
- You are tired of pasting console errors and network requests into chat
- You want accessibility, cookies or memory leaks checked step by step
Not for
- Only Google Chrome and Chrome for Testing are officially supported; other Chromium browsers are not guaranteed.
- The browser's content is exposed to the MCP client, so the README says not to use it with sensitive data.
- Usage statistics are collected by default; --no-usage-statistics turns them off.
- Performance tools may send trace URLs to the Google CrUX API; --no-performance-crux turns that off.
Reviewed by Devalley’s editor before publishing. How the column is made