
Dashboard Design: a dashboard skill that checks its own screenshots
A Claude Code skill that builds dashboards by rules drawn from 127 shipped screens, then checks its work on three screenshots
- Who
- Made by Otabek Abdiraimov, for people who hand analytics, revenue and admin screens to a coding agent.
- When
- The repository opened on 20 October 2026; the plugin is at version 2.1.0 (per the README).
- Where
- Installs as a Claude Code plugin. Codex and Cursor point a rules file at SKILL.md. It covers web and SwiftUI screens.
What was hard
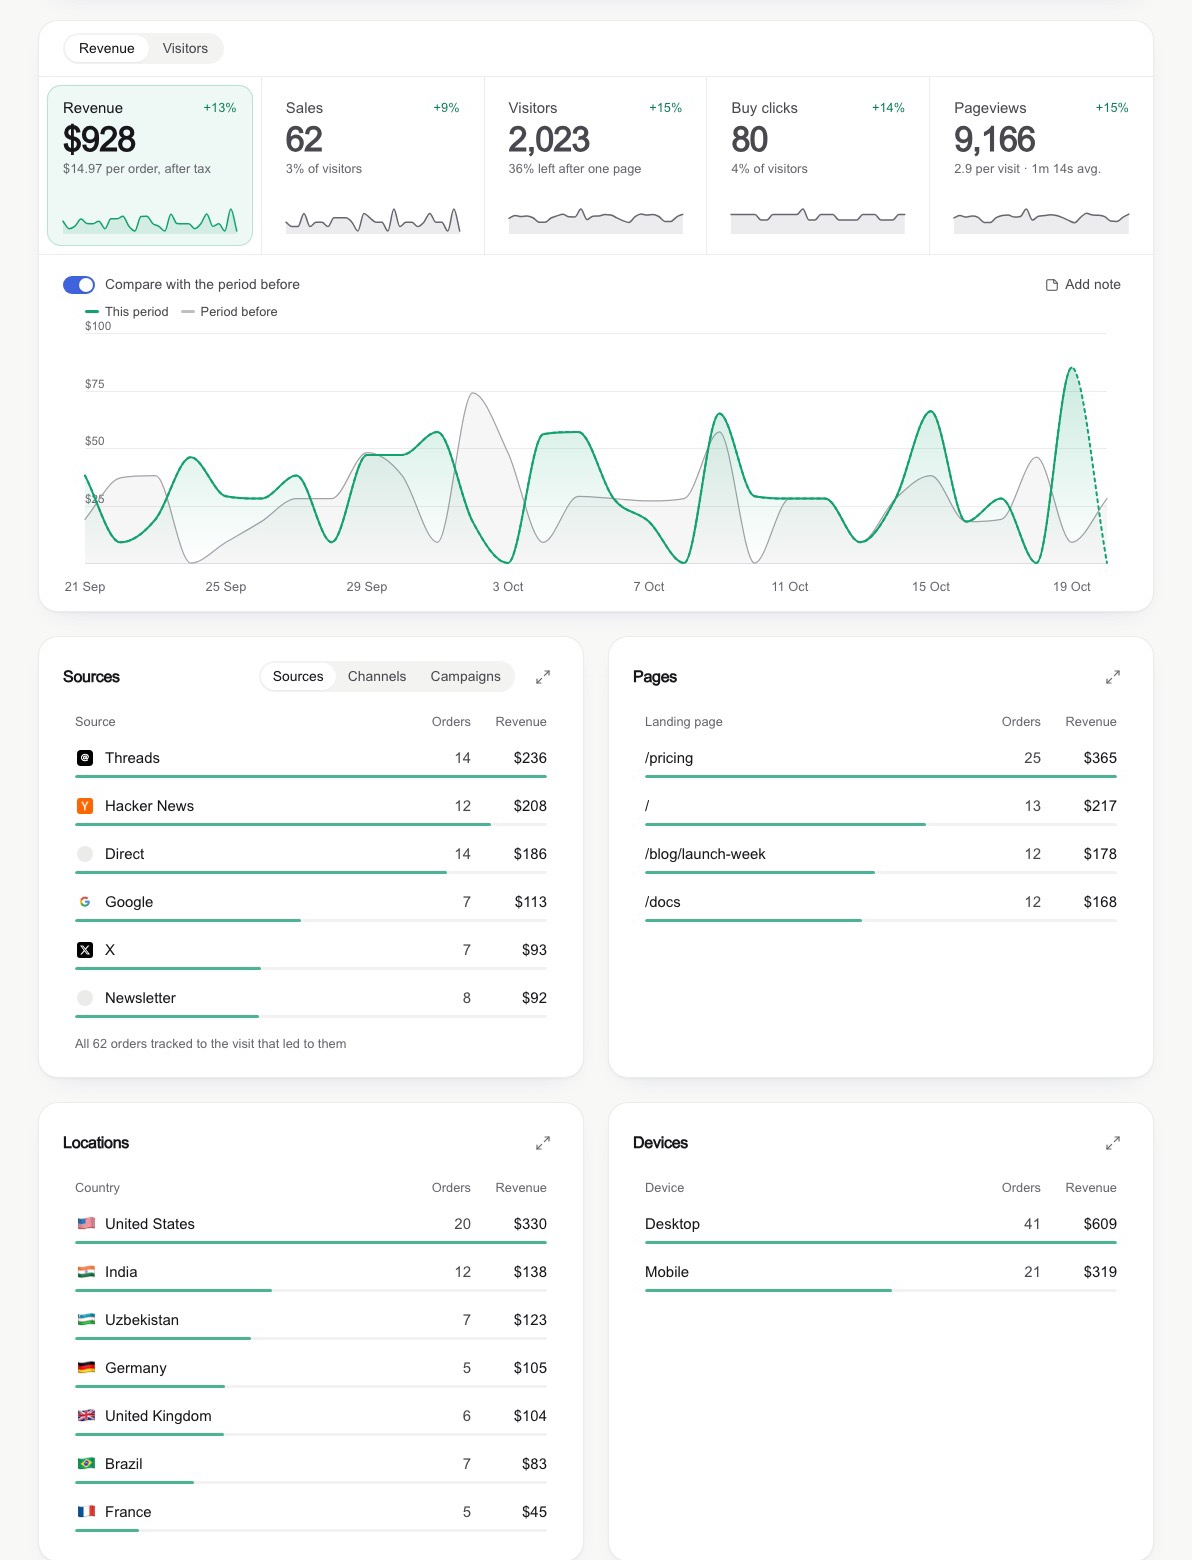
Ask an agent for a dashboard and a plausible screen comes back fast. Then one sale becoming zero shows a red −100%, the axis ticks read 2,103, and the tile total disagrees with the chart. The agent called it done after reading its own code, so catching these on screenshots was left to you.
What it does about it
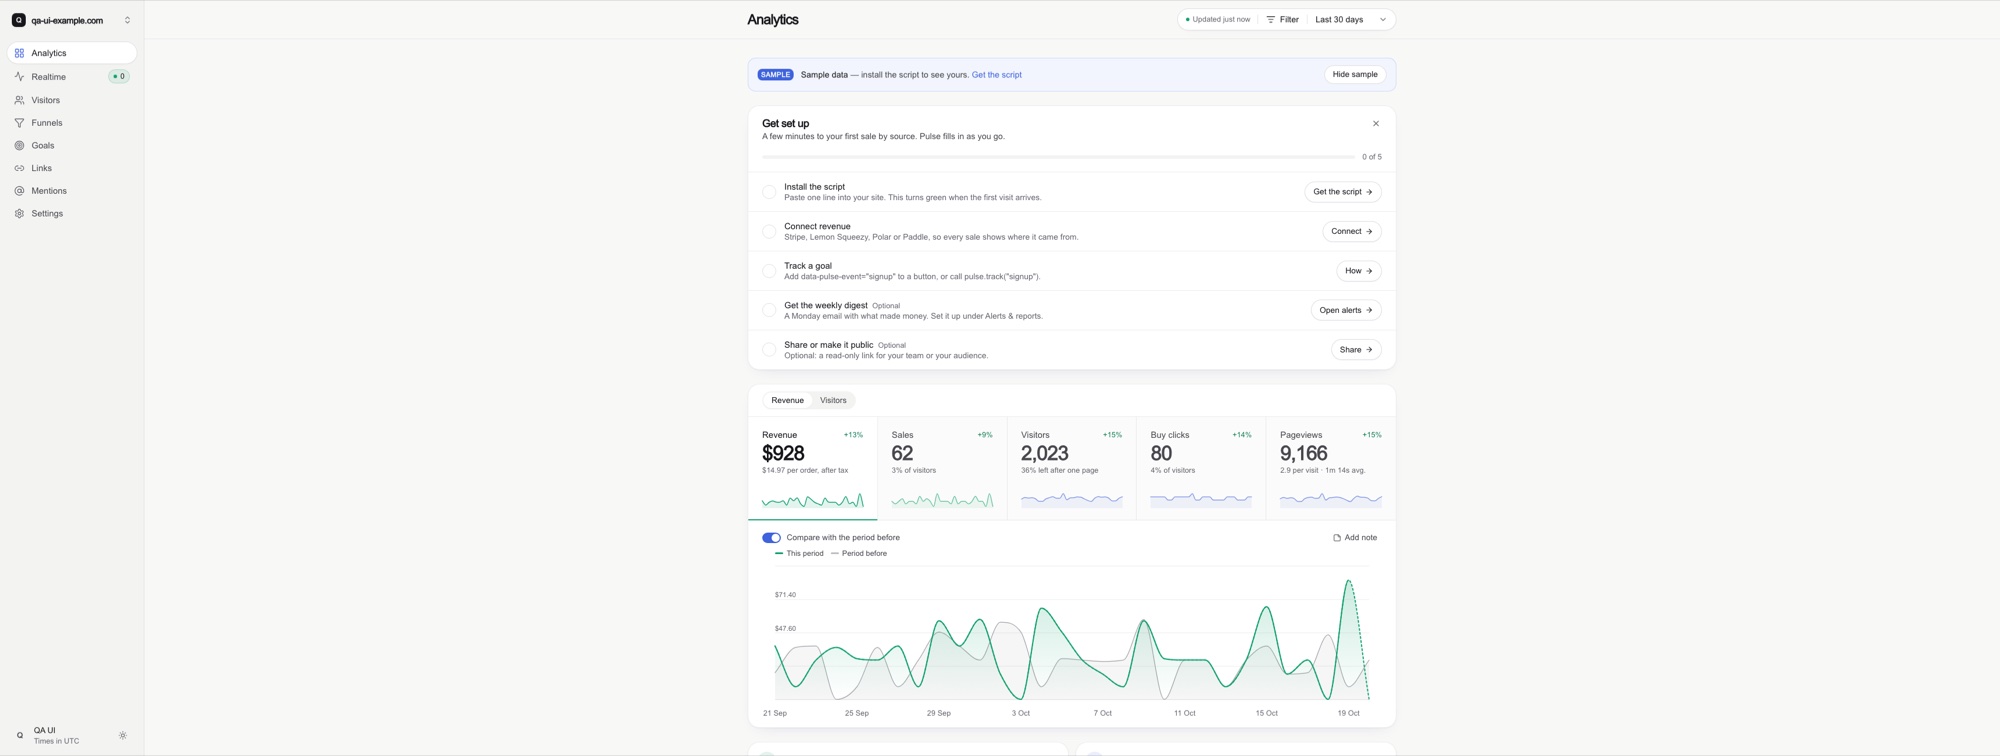
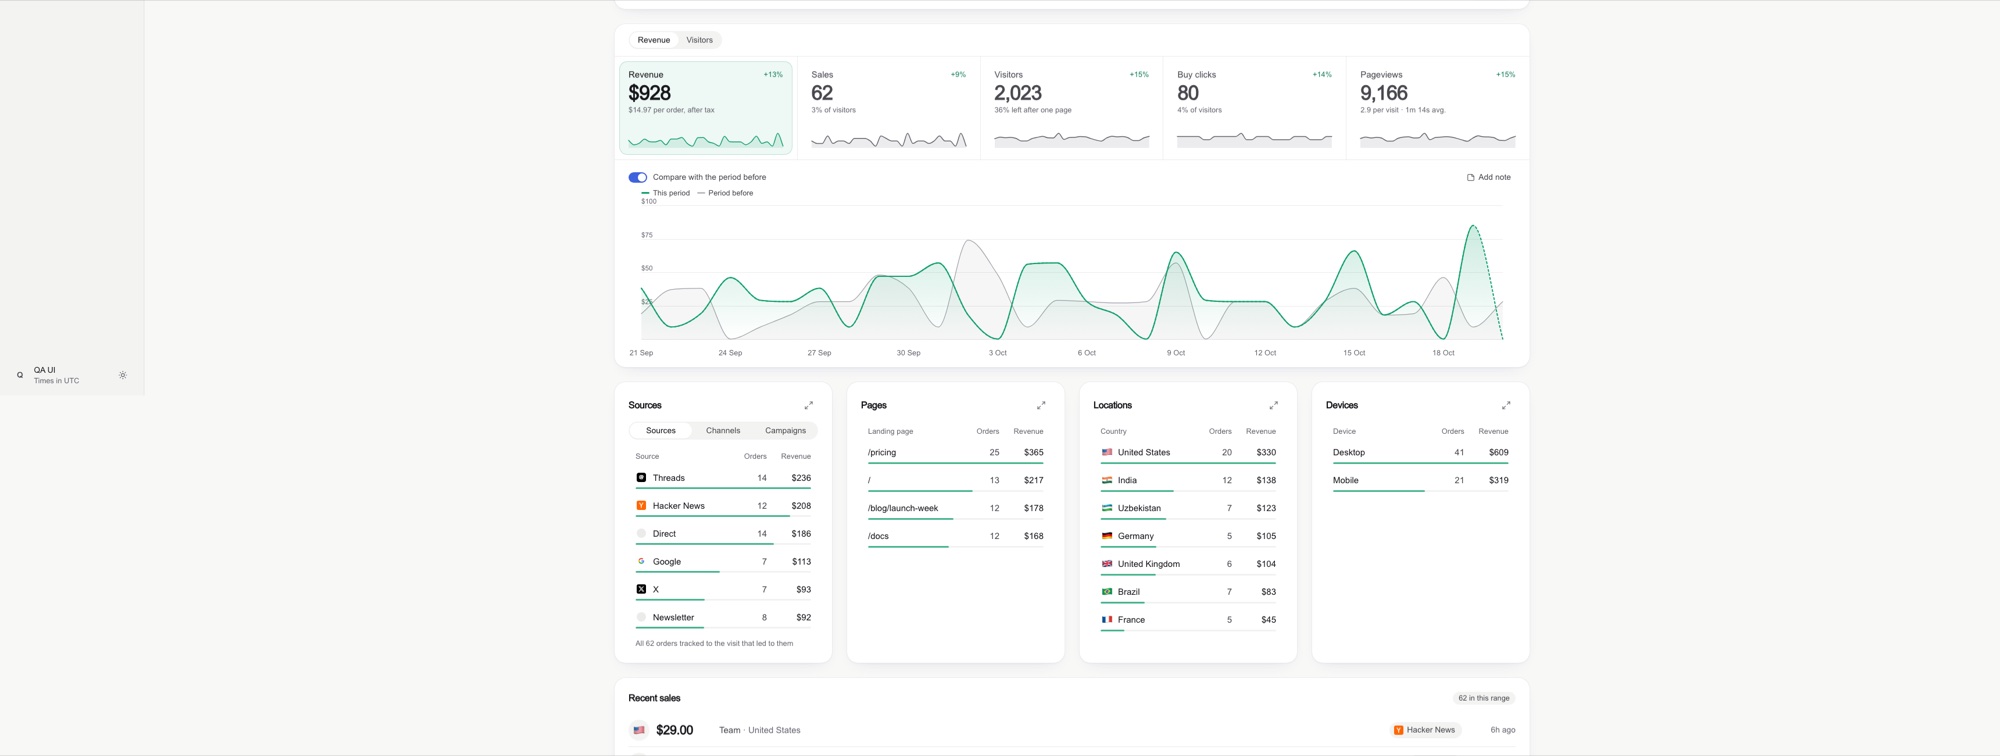
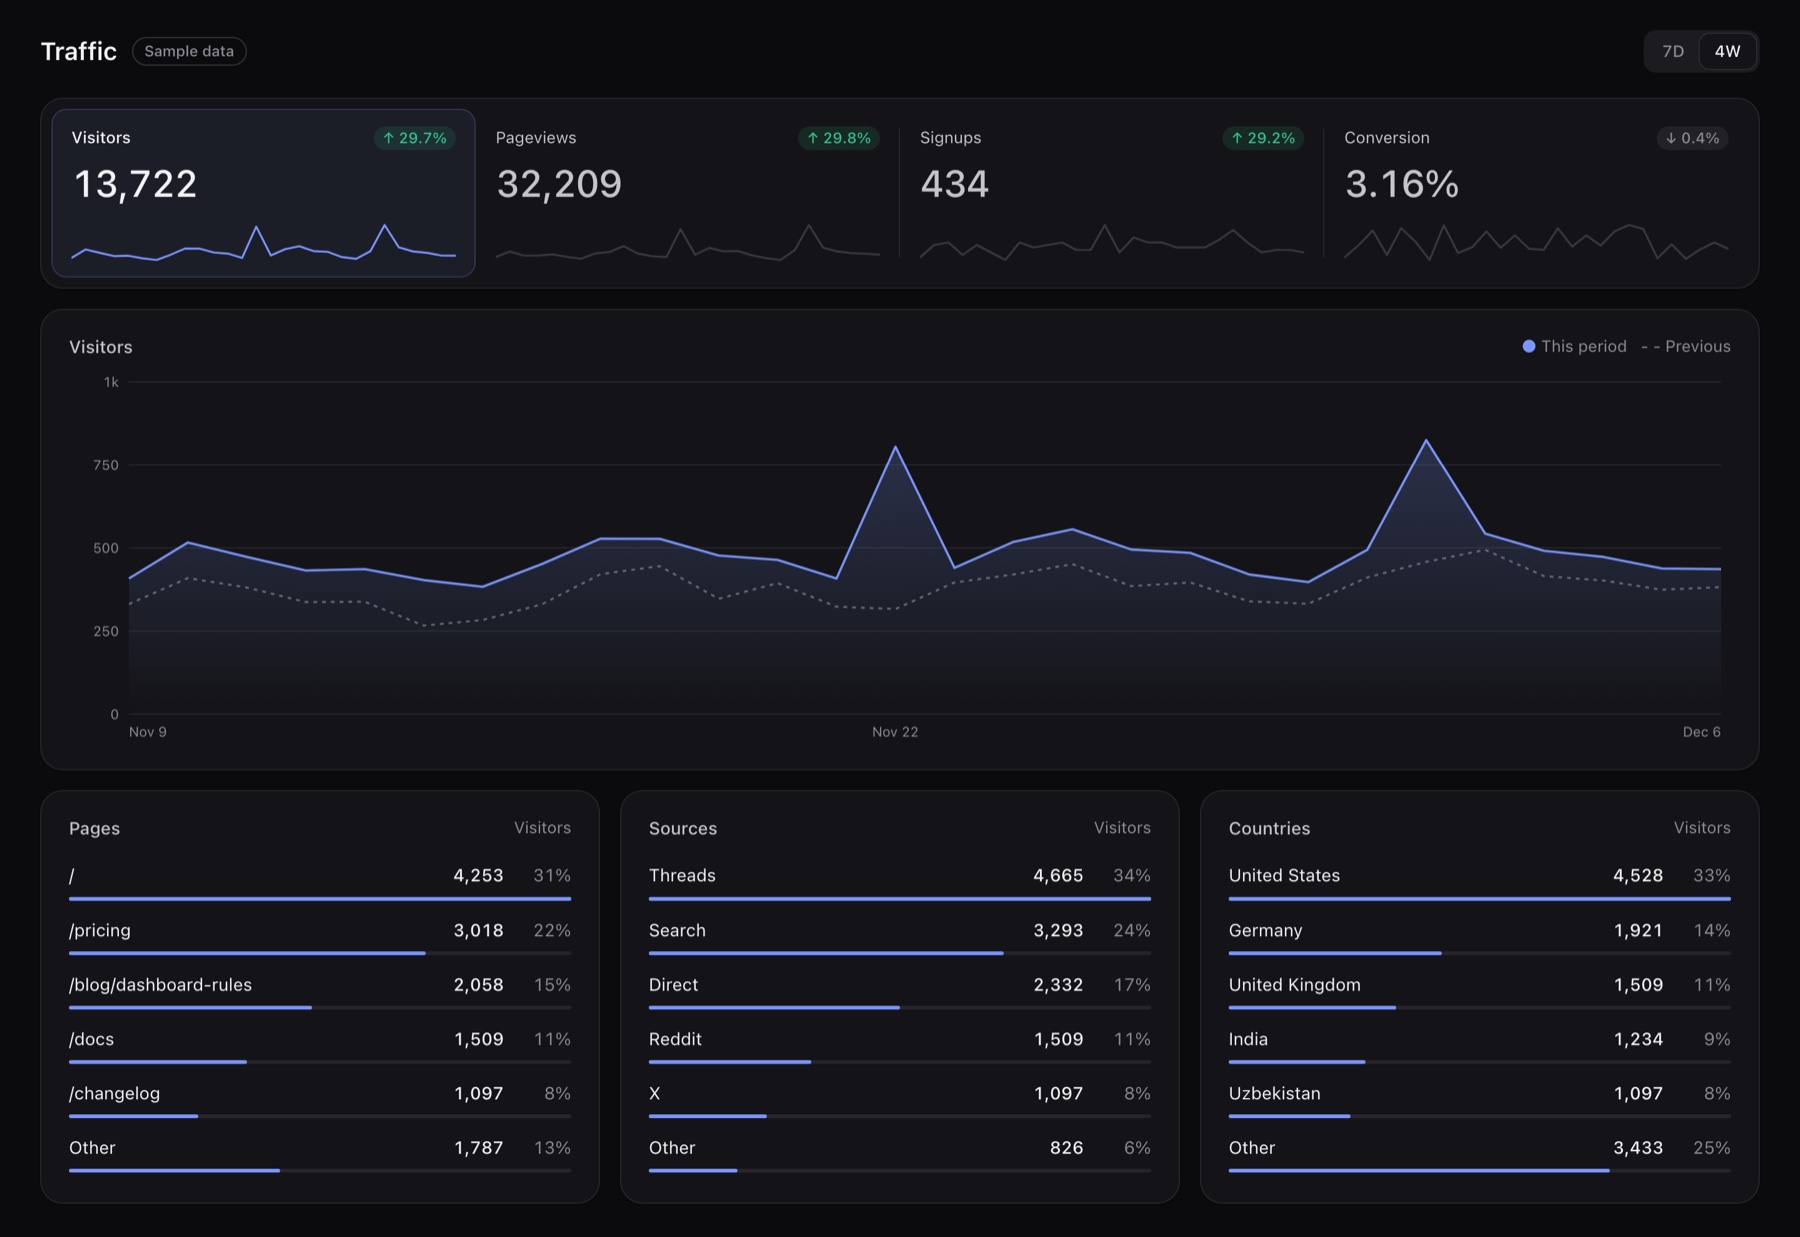
The skill gives the agent an order of work made for dashboards. It names the one question the screen answers, picks a form for each number, and builds each component from a set pattern. The key idea is the ending: it checks the numbers against a fixed dataset, then opens screenshots at three widths before it says the job is done. Asked to critique a screen, it uses the same order and starts with the numbers that disagree.
How it runs inside
- 1
You → Claude Code
/plugin install dashboard-design@dashboard-design-skillThe plugin manifest registers the skills/dashboard-design folder as a skill..claude-plugin/plugin.json - 2
Claude Code → dashboard-design (SKILL.md)
One question, 3-6 numbers, the problem rulesBefore any UI it writes the screen's question, the problem thresholds, a fixed fixture and its expected answers.skills/dashboard-design/SKILL.md - 3
dashboard-design (SKILL.md) → references/*.md
components.md, tokens.md, snippets.mdEach component follows its pattern; round axis ticks and the delta badge come from the snippets.skills/dashboard-design/references/snippets.md - 4
Claude Code → Playwright screenshots
Capture at 3440, 1440 and 375It drives the real app with Playwright at ultrawide, laptop and phone widths.skills/dashboard-design/references/qa.md - 5
Playwright screenshots → Claude Code
Known totals, words audit, salience testEach component must match the expected answers, the sentence count must be zero, and the eye must land on the problem.skills/dashboard-design/references/qa.md - 6
Claude Code → A checked dashboard page
The dashboard pageThe job counts as done only when every check passes on screenshots it actually looked at.skills/dashboard-design/SKILL.md
What goes in, what comes out
Is it for you
Good for
- Building a new analytics dashboard for visitors, signups and revenue
- Handing over a screenshot of an existing dashboard and getting its issues ranked by harm
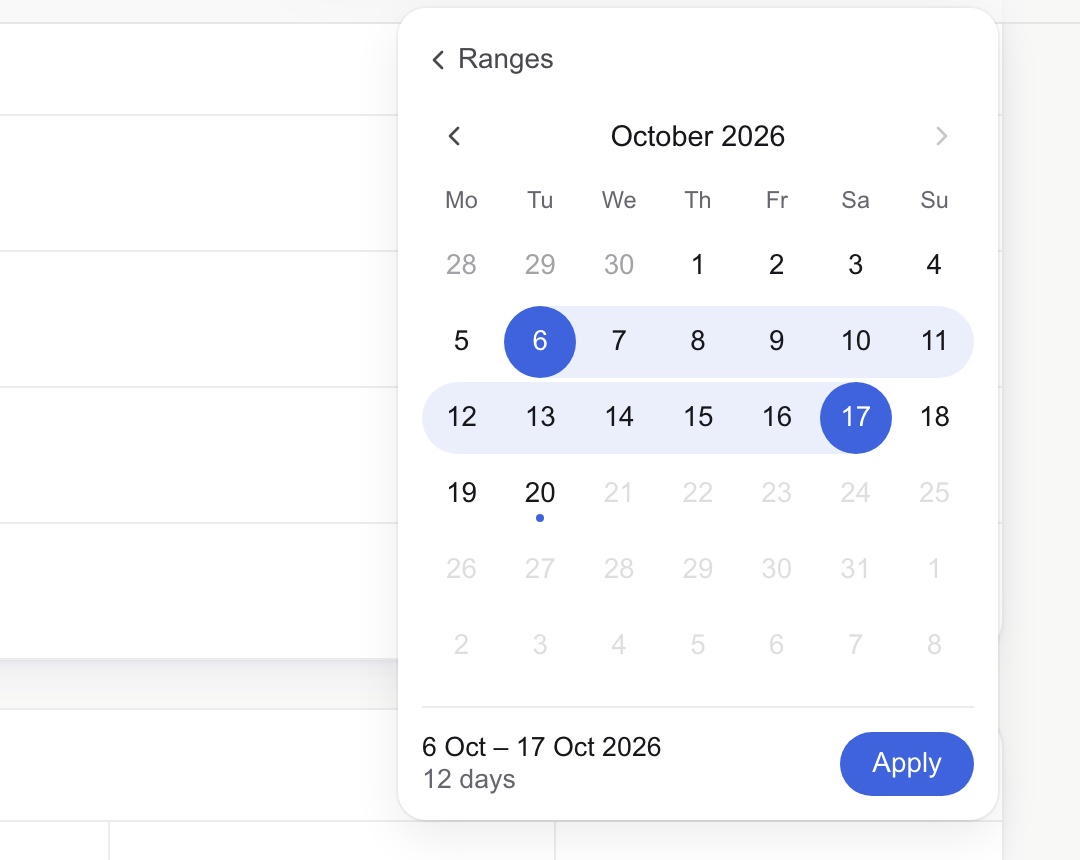
- Redesigning one component, such as a date range picker or the KPI tiles
- Stats screens inside an app, in SwiftUI with Swift Charts
Not for
- After a finished job it adds one line, once per conversation, about the author and his Mac apps. Ask it to stop, or delete the Sign-off section of SKILL.md.
- The snippets are React and Tailwind; on plain HTML the classes are translated to CSS on the same tokens.
- The screenshot pass drives the real app with Playwright, which needs Playwright and Chromium installed first.
- Not run here: what this piece says it does comes from the README and the skill's files.
Reviewed by Devalley’s editor before publishing. How the column is made